Among the various HTTP return status codes that we receive, the two most frequent ones are 401s and 500s. While the 401s are more related to authentication and authorization, the 500s are because of problems within IIS. I am listing various things to check and ways to troubleshoot the HTTP 500 errors for IIS web applications in general and SharePoint 2010 applications in particular.
- The first thing you want to check when you receive this error, when you hit the root site of the web application, is the status of the application pool of the website. Is the application pool running?Crashed? Is the application pool properly associated with the web application?
- There is could be a possible 500 server errors in some scenarios based on the load balancer configuration. There are few settings for IIS application pools that that recycle the application pool at preconfigured intervals, by default every day. When the web applications are hit after recycle or the pool dies out the memory, I have learnt that the IIS 7.5 takes some time to WARM UP and if the load balancer’s time out is not configured to be greater than the warm up time, it is going to tell back to the client that there is some error. So make sure you have properly configured those time-outs and if you see such type of issues, just set up a warm job that keeps on pinging the URL of the web application.
- You can see the trace logs in SharePoint 2010, whether there are any assemblies that got knocked out of the assembly. If so, make sure they are added back and reset IIS to get the replaced .dll picked up.
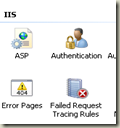
- If you do not see any of these work, Microsoft has given a nice feature with in IIS to trace out the failed requests. Probably this should be used by every single administrator who works on IIS. This is called “Failed Request Tracing Rules” available under IIS section in the Features view of each web site.
- Enable the Failed Request Tracing logs and configure the location to store the trace logs.
- After that, double click on the feature to add the trace rules. Click on Add button to add the content source, select All Content. Click Next.
- Select the status code option and give 500 as the status code. Click Next.
- Select all the provider options shown in the screen and click finish. Now a trace rule gets added in the list of the feature.
- Go ahead and hit the application in the browser and see the 500 error again. Couple of files get created in the directory where you have configured the logs should go.
- Open the xml file in Internet Explorer (MUST). If you open the xml in any other xml editor, you may not see the XML styles getting applied.
The opening page will show the errors and warnings that IIS has encountered while processing the HTTP request. Those traces will provide you a direction to troubleshoot the issue.
In particular to SharePoint 2010, the issue I faced was that the My Sites web application was not coming up and it was giving the 500 internal server error. When I did the Failed Request tracing explained above, I have seen couple of warnings in the log as shown below.
I opened the applicationHost.Config which is the one of the IIS metabase files where the details about Sharepoint14Module were present.
<add name="SharePoint14Module" image="C:\Program Files\Common Files\Microsoft Shared\Web Server Extensions\14\isapi\owssvr.dll" preCondition="appPoolName=S………
The preCondition property value of this key is missing my application pool name in that list. I have added the application pool of the my sites web application and it started working.
Hope this helps for your troubleshooting and thanks for reading.


No comments:
Post a Comment